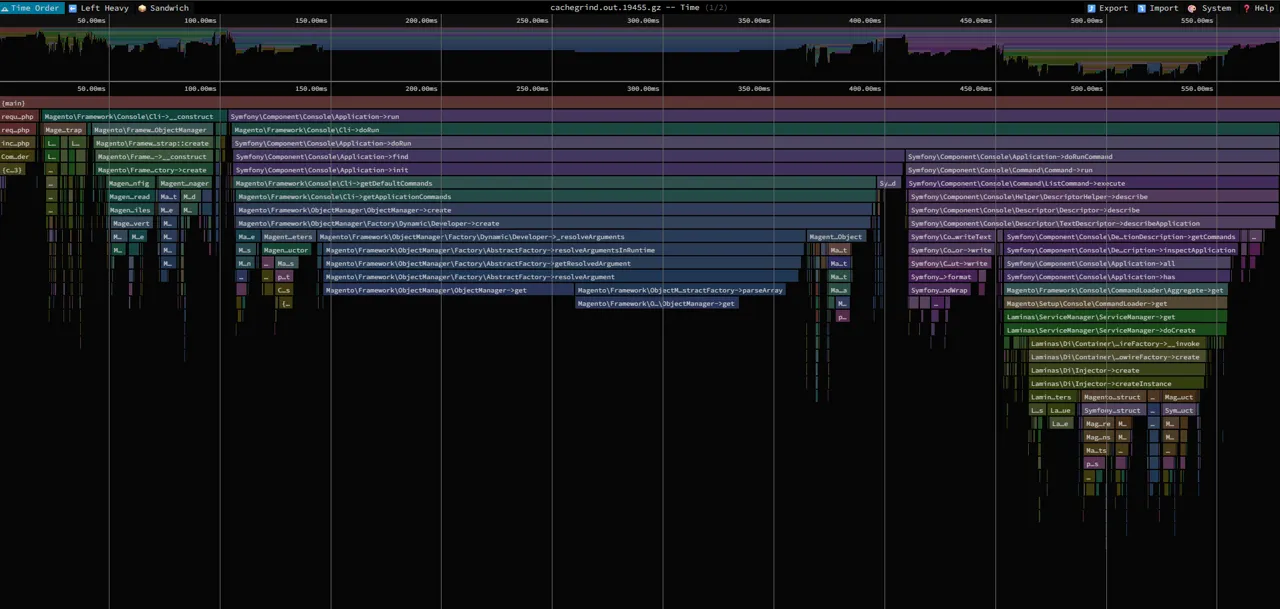
Speedscope
Speedscope is a lightweight browser-based viewer for performance profiles generated by Xdebug (and other tools). It is pre-installed in the devcontainer via the @mappia/speedscope npm package.
Usage
Speedscope can visualize cachegrind files generated by Xdebug's profiler.
- Generate a profile by triggering Xdebug's profile mode:
bash
XDEBUG_PROFILE=1 bin/magento- Open the profile in Speedscope:
bash
speedscope --serve /tmp/cachegrind/cachegrind.out.file.gz- VS Code will automatically open a browser tab for the performance profile.
INFO
You can also optionally navigate to the Ports tab in VS Code and open the Speedscope port in your browser if you accidentally close this tab.