Xdebug
Xdebug is pre-installed and configured in the PHP container. No further setup is required.
Capabilities
Debugging in the devcontainer
The PHP Debug extension is installed automatically when the devcontainer starts.
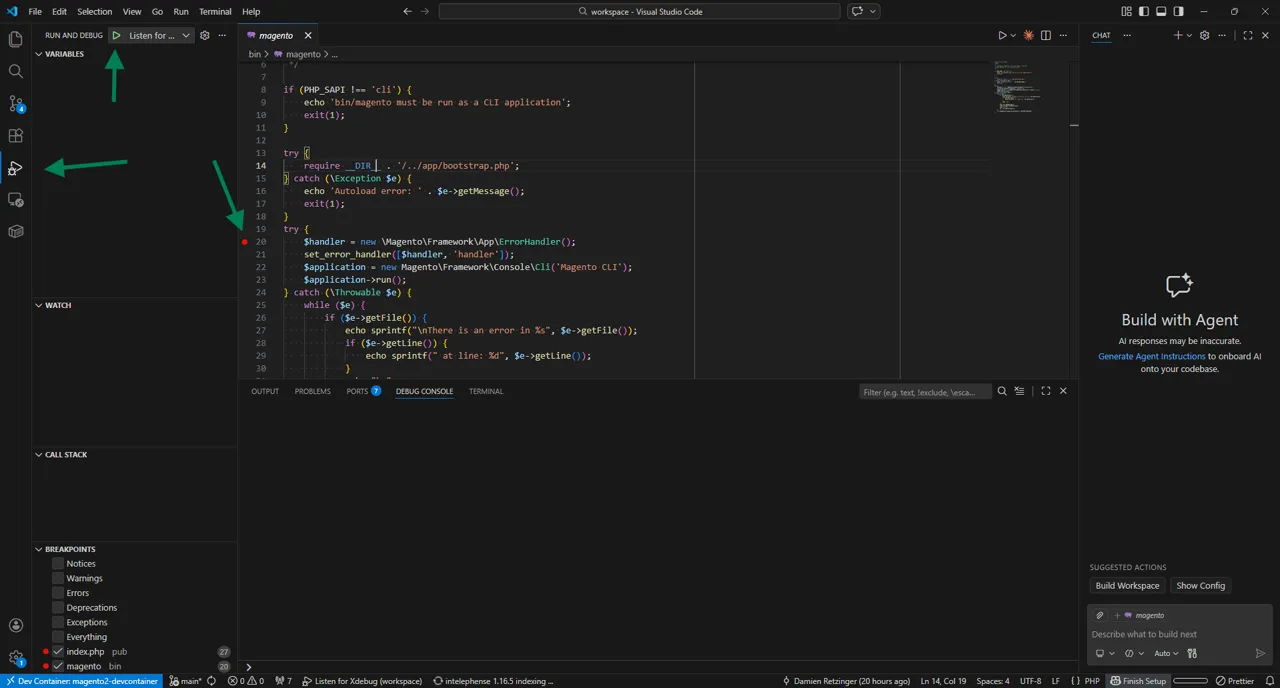
To start debugging:
- Open the Run and Debug panel (
Ctrl+Shift+D) - Click create a launch.json file and select PHP
- Set a breakpoint in your code
- Click Start Debugging (
F5) and select Listen for Xdebug
Example launch.json
{
  "version": "0.2.0",
  "configurations": [
    {
      "name": "Listen for Xdebug",
      "type": "php",
      "request": "launch",
      "port": 9003,
      "pathMappings": {
        "/workspace": "${workspaceFolder}"
      }
    }
  ]
}
Browser Requests
Use the Xdebug Browser Extension to set the trigger automatically or append ?XDEBUG_SESSION=1 to any URL to trigger a debugging session.
CLI Commands
Set the XDEBUG_SESSION environment variable before running a command to debug that command:
XDEBUG_SESSION=1 bin/magentoVerify that it's working
You easily verify that your devcontainer's xdebug configuration is working by opening the bin/magento file in your project, putting a breakpoint on the handler and then executing the following.
XDEBUG_SESSION=1 bin/magento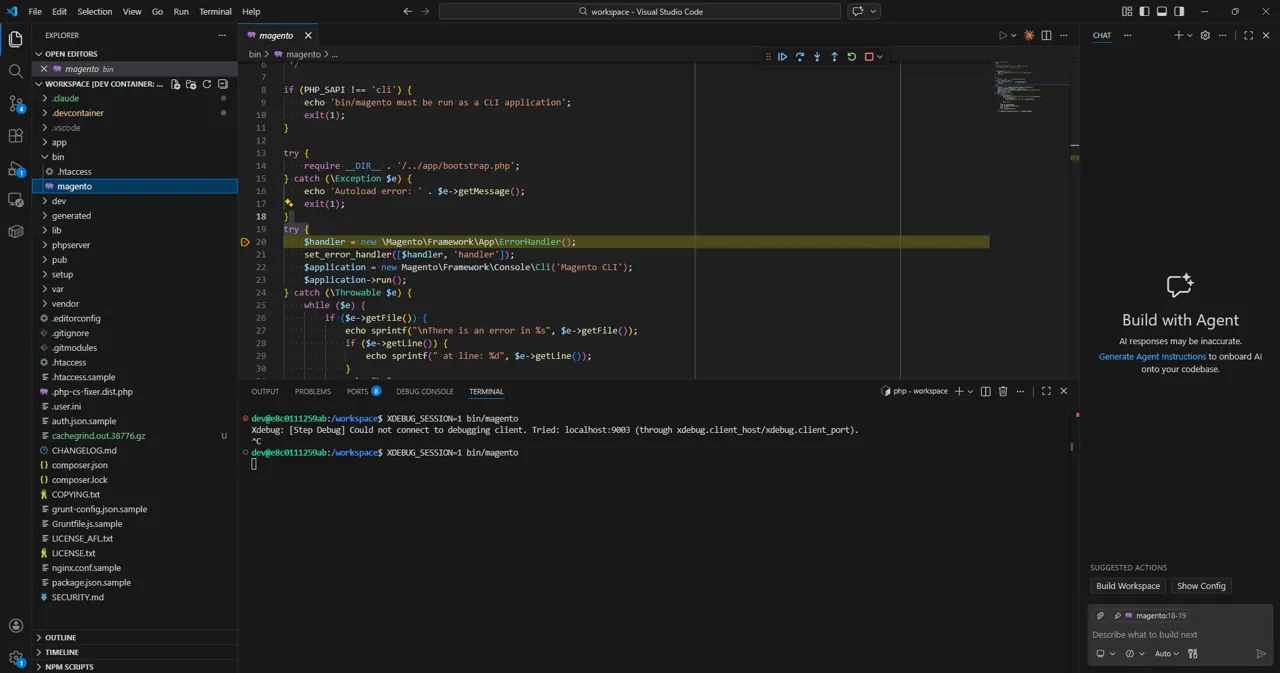
You should be stopped on the breakpoint you set and be able to step through the code.
Profiling
The devcontainer configures Xdebug with profile mode enabled by default. Profile output is written to /tmp/cachegrind inside the container by default. You can analyze the generated cachegrind.out.* files with the built-in speedscope tool.
speedscope --serve cachegrind.out.file.gz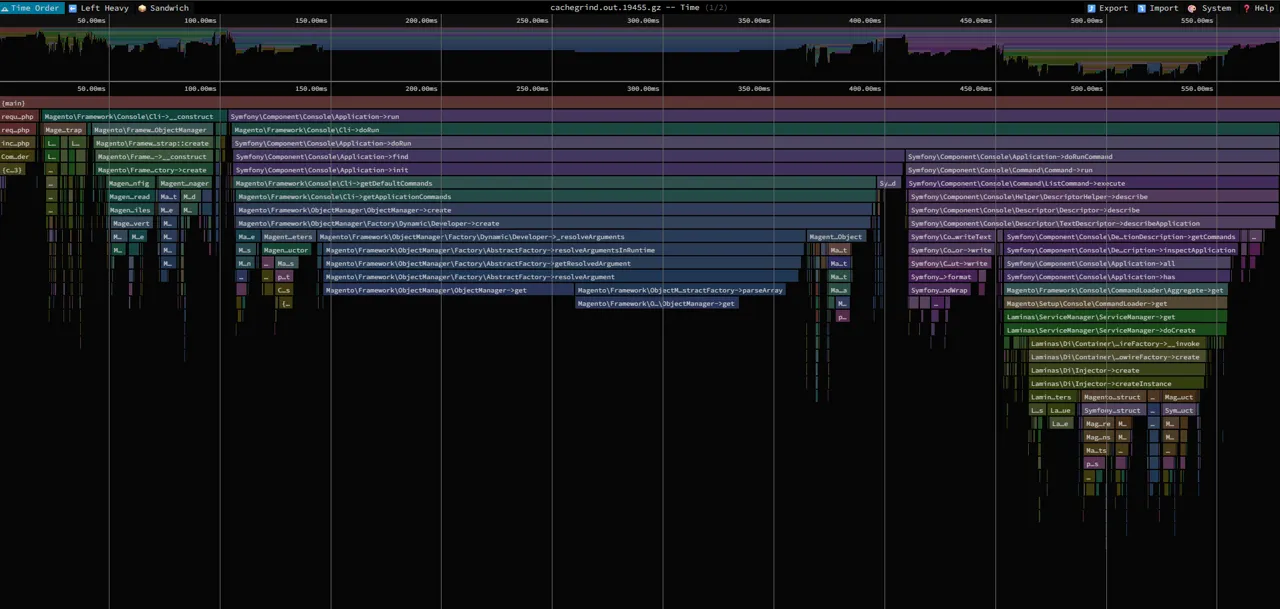
Browser Requests
Use the Xdebug Browser Extension to set the profile trigger automatically or append ?XDEBUG_PROFILE=1 to any URL.
CLI Commands
Set the XDEBUG_PROFILE environment variable before running a command:
XDEBUG_PROFILE=1 bin/magento